How Did a Mountain Collapse Become Nepal’s Flood?
On the morning of August 26, 2026, rock and glacier ice broke away from a mountainside in the Langtang region, near Nepal’s border with China, and rushed into the valley below. The moving mixture picked up water and debris…
On the morning of August 26, 2026, rock and glacier ice broke away from a mountainside in the Langtang region, near Nepal’s border with China, and rushed into the valley below. The moving mixture picked up water and debris, following river channels through the Rasuwagadhi border crossing and into communities along the Trishuli. Scientists at the US Geological Survey (USGS) estimate that the debris flow and flooding travelled approximately 100 kilometres. [1] Along that route, the floods damaged homes, bridges, roads, and hydropower facilities. Broken transport links and damaged health services then made it harder to reach and treat people in the affected communities. [2]
Stuart Dunning, a geomorphologist at Newcastle University who studies mountain hazards, is investigating whether rock fell first and carried the glacier with it, or whether the glacier detached before the rock above. His early reconstruction does not settle that order. It does describe how the avalanche gained water and eroded the valley on its way down, adding to the material that originally broke away. [3]
What Happened Above Rasuwa?
Dunning estimates that the avalanche started at about 4,800 metres above sea level, with the rock and ice falling more than 1,200 metres. [3] It entered a valley connected to the Lende Khola and Trishuli rivers. USGS scientists traced the flow along these channels, showing how material from the mountain could reach settlements downstream. [1]
By the time the Landsat 9 satellite passed over the area, about two hours after the collapse, water and debris marked the valley beside the glacier. The European Space Agency (ESA) compared that August 26 image with a Sentinel-2 image from August 24 to show the change. Clouds obscure parts of the scene, so ESA used shortwave-infrared measurements to help distinguish ice and water from cloud. In the image below, the glacier sits near the border while the labelled flood water and debris follow the valley away from it. [4]
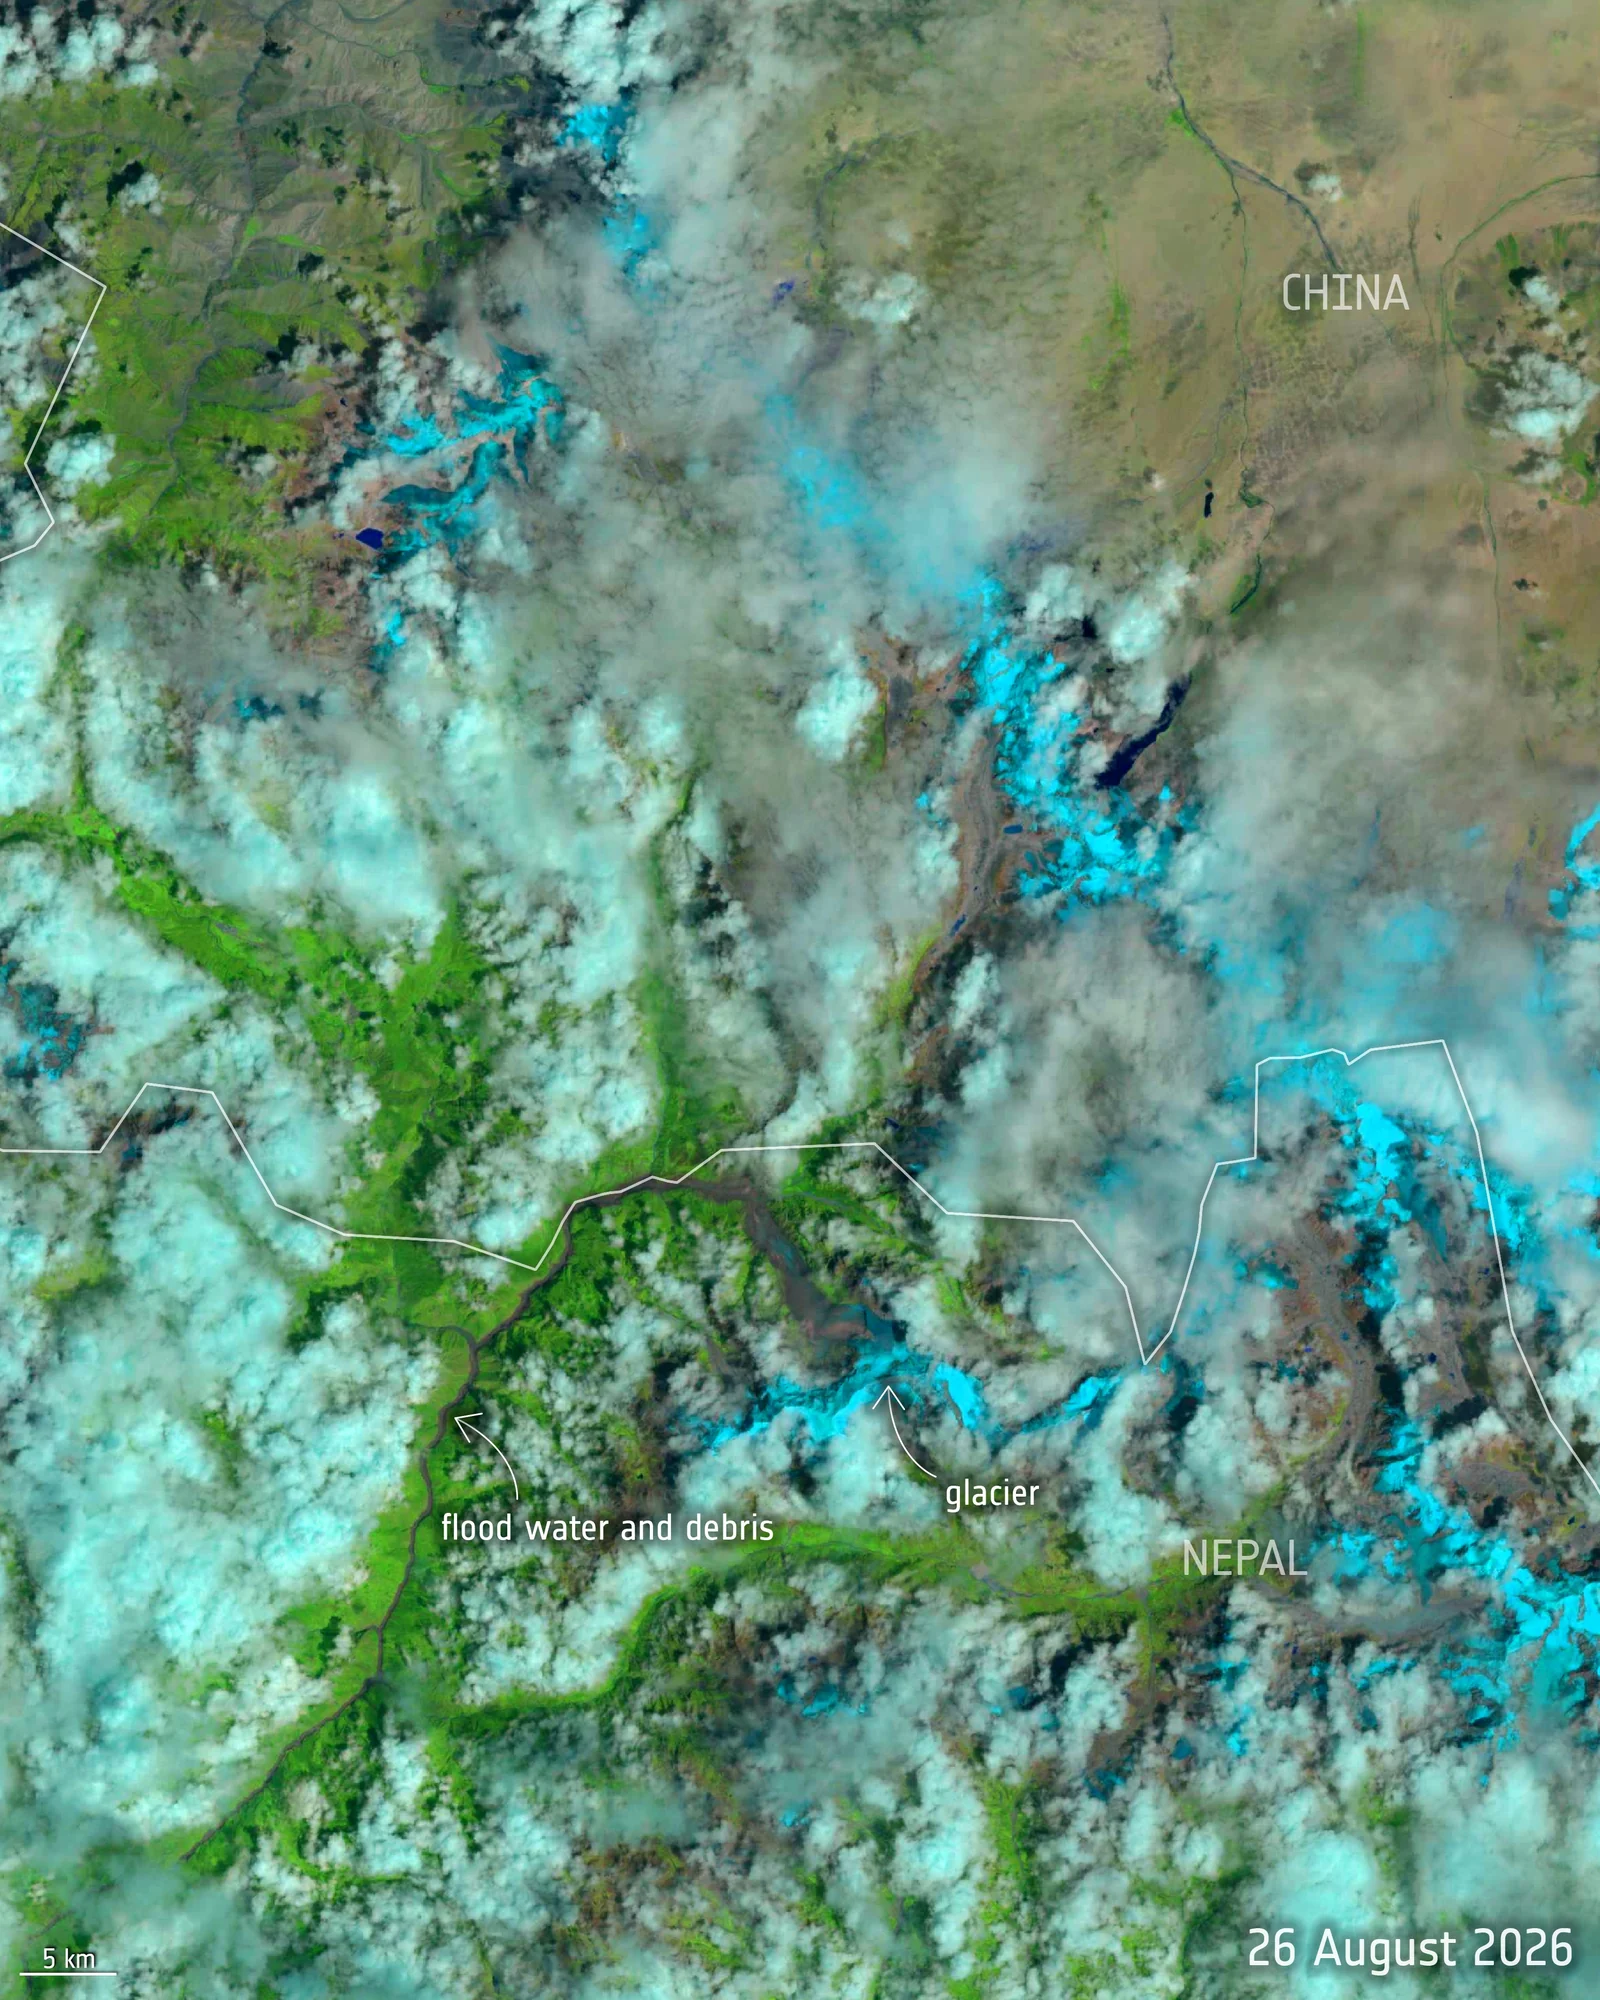
Figure 1. Landsat 9 captured the source region on August 26, approximately two hours after the collapse. ESA’s labels identify the glacier and flood water and debris. The shortwave-infrared composite uses colours that differ from what a human observer would see. [4]
Credit: contains modified Copernicus Sentinel data (2026) and Landsat-9 data, processed by ESA / CC BY 4.0 International. Image unchanged.
Although satellites did not capture the collapse itself, seismometers on the ground recorded the motion it produced. EarthScope shared recordings of a magnitude 5.2 seismic event associated with the collapse and debris flow. The signal came from the falling and moving mass, so the magnitude does not by itself establish that an earthquake triggered the avalanche. The recordings provide evidence of when the rapid movement occurred. [5]
Researchers at the Center for Land Surface Hazards, or CLaSH, matched that timing to the flood’s arrival downstream. Their September 2 reconstruction put only about seven minutes between the initial failure and the surge reaching nearby Gyirong. That short interval challenged an early explanation: that avalanche debris had dammed the river, a lake had filled behind it, and the dam had then broken. The team concluded that a substantial new lake could not have accumulated enough water in that interval to supply the main surge. [6]
Two lakes appeared behind debris in satellite images after the initial flood. They created a potential source of later flooding, but cannot explain the first surge simply because they were present afterward. CLaSH’s preliminary reconstruction points to water joining the avalanche during its descent rather than accumulating in a new lake before a dam burst. [6] Ice melting within the flow and water from rivers along its route could both contribute. [1][7]
How an Avalanche Became a Flood
Gravity accelerated the falling rock and ice, while impacts broke the mass into smaller pieces. As those fragments collided and rubbed against each other and the ground, some of their energy of motion became heat, much as bicycle brakes heat up during a descent. Where ice is present, that heat can melt some of it and change the mixture as it moves. [7]
The amount of meltwater depends on how heat moves through the mixture. Ice below its melting temperature must first warm up, then absorb further energy to become liquid, while rock and other material also take up heat. Jessica Munch and colleagues model rock, ice, and water separately to account for this. Heat in the rock produces meltwater only after it transfers to the ice, so calculating the water released requires information about the composition and the rate of heat transfer. The missing glacier’s size alone is not enough. [8]
Water mixing with broken rock and soil can turn an avalanche into a debris flow, a dense mixture of solids and water moving downhill. The rocks still collide, rub together, and transfer forces as solids, while water moves between them. Changes in the quantity and distribution of water alter the resistance to motion, allowing the flow to become more mobile without all its ice melting. [7]
Reaching a stream gives the flow access to water that is already liquid. It can collect this water, scrape sediment from the bed, and erode the banks, adding material as it travels. This incorporation of material from the path is called entrainment. A limited initial collapse can therefore become a much larger flow farther down the valley. [9]
Adding stationary sediment does not automatically make a flow faster. The new material has to accelerate, which tends to slow the moving mixture if resistance remains unchanged. Whether the flow gains speed also depends on the contact between the debris and the ground, where wet sediment can alter the resistance beneath it. [9]
Wet sediment contains water in small spaces, or pores, between its grains. The weight of a passing debris flow can increase pressure in that water, allowing it to support more of the load. The grains press less firmly together, reducing the friction that resists movement. This pore-water pressure can help the flow erode material while also reducing resistance beneath it. [10]
Richard Iverson and colleagues tested this sequence in large-scale experiments. When high water pressures developed in wet sediment beneath a debris flow, the flow scoured the bed and gained speed as it grew. With drier sediment, picking up material instead reduced its momentum, the product of its mass and speed. The wet bed allowed a feedback to develop: erosion added material while reduced friction helped keep it moving. These experiments explain how growth and acceleration can occur together; measurements from Nepal would be needed to establish the strength of that feedback in this flood. [10]
The illustration below shows how Munch and colleagues represent these additions. Rock, ice, and water enter from the ground as the avalanche descends, while friction produces meltwater within it. Tracking these sources separately allows the model to follow changes in the mixture. [8]
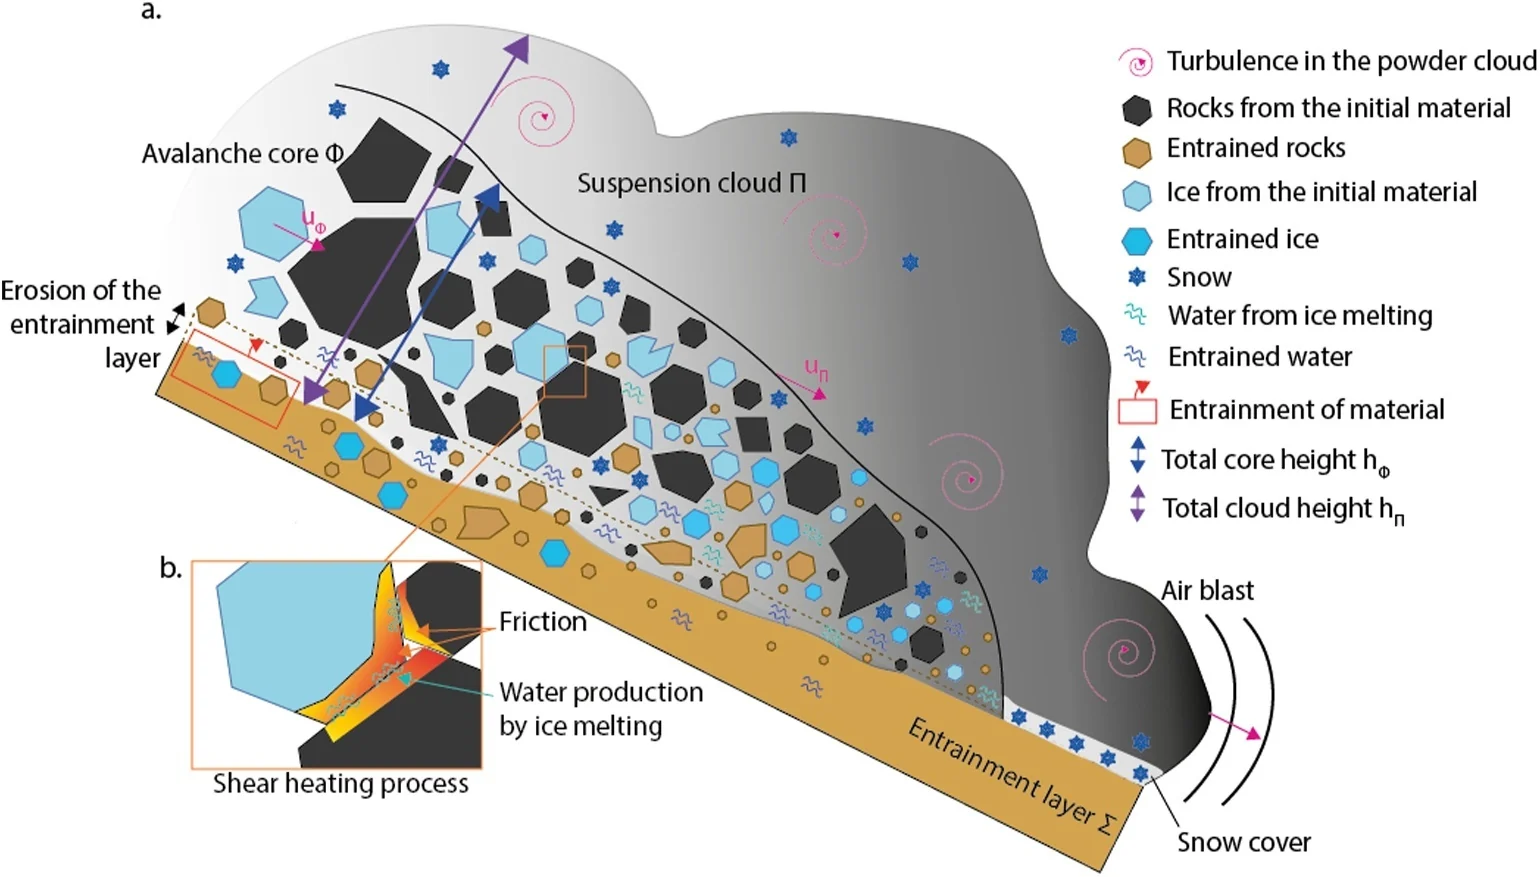
Figure 2. Processes in a rock-and-ice avalanche model, including the incorporation of material from the ground and melting through frictional heating. Reproduced from Figure 1 of Munch et al. (2024). The illustration explains model processes; it does not reconstruct the August 2026 Nepal event. [8]
Credit: Munch, Zhuang, Dash, and Bartelt (2024) / © 2024 The Authors / CC BY-NC 4.0. Figure content unchanged.
Erin Harvey and colleagues studied how loose sediment in channels affected debris flows after China’s Wenchuan earthquake. Their observations and simulations showed that sediment-rich channels could produce unusually large flows. In simulations with the same starting volume, changing either the depth of available sediment or its water content altered how far the flow travelled. Conditions along the channel helped determine the reach of the disaster. [11]
For Nepal, measuring the missing mountainside would help estimate the starting volume, while measuring sediment removed from the river corridor would help establish what the flow collected downstream. Harvey’s findings explain why both are needed: the initial collapse may account for only part of the material that eventually reached settlements. [11]
Scientists have reconstructed such a transformation at Chamoli in the Indian Himalaya. On February 7, 2021, roughly 27 million cubic metres of rock and glacier ice collapsed from Ronti Peak. A team led by Dan Shugar followed the material’s descent using satellite images, seismic recordings, videos, and modelling. They showed how the avalanche developed into a fast-moving debris flow that severely damaged two hydropower projects downstream. Their reconstruction connected the missing mountainside to the destruction along the river—the sequence that researchers are now working to establish for Nepal. [12]
As the flood travels, it can reshape the channel carrying it. Kristen Cook and colleagues documented intense erosion during an earlier flood in Nepal’s Bhotekoshi–Sunkoshi catchment. That flood began when a glacial lake released water, a different trigger from the August 2026 collapse, but it showed how a sudden surge could strip material from a Himalayan river corridor. Erosion changes the bed and banks through which the remaining floodwater—and later river flows—must pass. [13]
Along the Trishuli, the August 2026 surge left a change large enough for satellites to record far downstream. ESA compared Sentinel-2 images from August 12 and August 27; the later image, shown below, reveals a much broader muddy river. By then, a day had passed since the collapse. The image records the swollen river at that moment, after the moving water and sediment had already travelled through the valley. It cannot show how high the flood peaked or how quickly it arrived. [14]
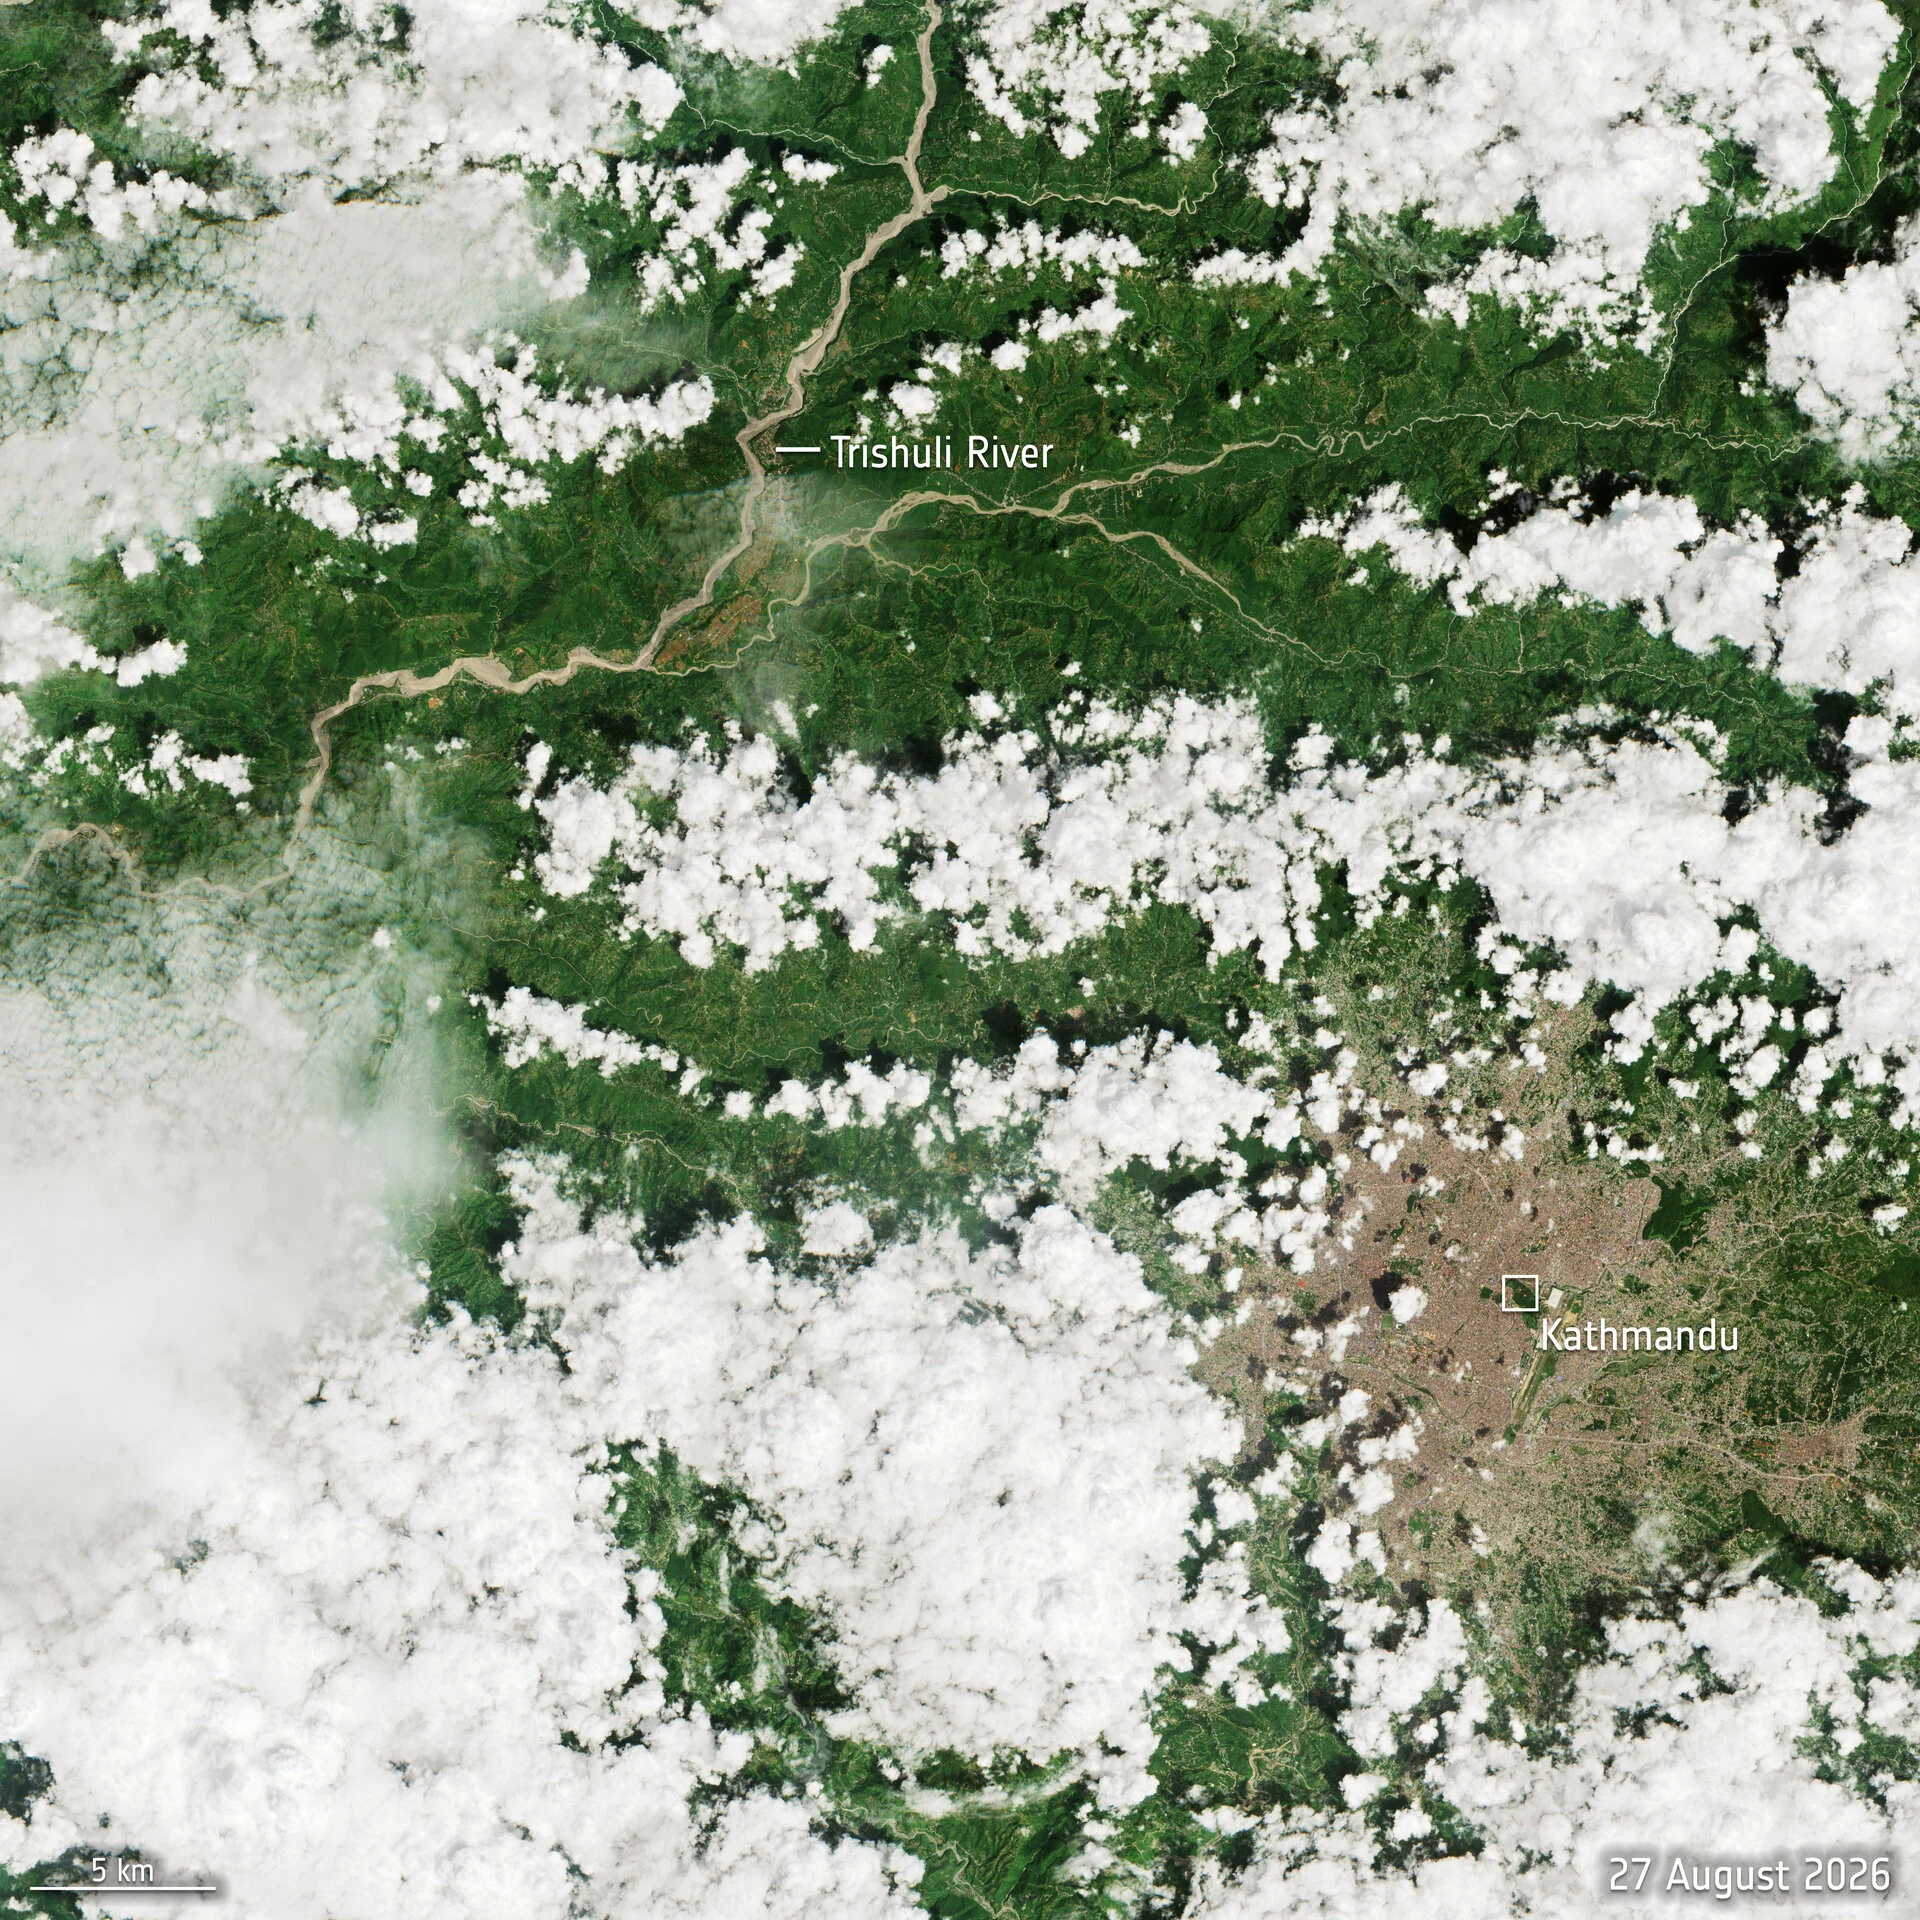
Figure 3. Sentinel-2 captured the expanded muddy Trishuli River on August 27, the day after the disaster. Clouds obscure parts of the natural-colour image. Kathmandu provides a location reference; its label does not indicate that the city flooded. [14]
Credit: contains modified Copernicus Sentinel data (2026), processed by ESA / CC BY-SA 3.0 IGO. Image unchanged.
What Can Scientists Detect, and How Can It Help?
CLaSH researchers are combining seismic records with videos, photographs, and river measurements to reconstruct what happened between the satellite images. A seismic record can establish the time of collapse, while a video from a known place can show when the surge arrived and what it contained. Comparing these observations along the river helps estimate travel speeds, although the timing and speed estimates remain preliminary. [6]
Researchers can also search older images for movement before a mountain fails. After Chamoli, a team tracked the block that eventually collapsed through five years of satellite observations. It had moved more than 10 metres horizontally and vertically before breaking away. Repeated images could reveal that displacement because they recorded the same part of the mountainside at different times. Yet the researchers concluded that satellite data alone probably could not have predicted when the block would fall. [15]
Detecting movement before a collapse could help identify slopes that need closer monitoring and instruments. It does not necessarily show when evacuation is needed. At Chamoli, earlier displacement revealed a moving block but did not provide a reliable countdown to failure. A warning system has to account for the difference between observing movement and knowing that collapse is imminent. [15]
Once a collapse begins, its ground vibrations can give people downstream another chance to receive a warning. Seismic waves travel through the ground faster than the destructive flow moves down the valley. Kristen Cook and colleagues used Chamoli’s recordings to show that a regional seismic network could detect and track successive stages of the disaster. Their analysis indicated that a system using the existing network could have issued warnings within minutes of the collapse beginning. They established this possibility afterward by analysing the records; the study did not document an operational warning issued during the event. [16]
Warning time also depends on the distance downstream. The flow continues while instruments process its signal, authorities communicate an alert, and people move to safety. Communities close to the collapse may have very little time, while those farther away may have longer. Any estimate for Nepal would need to include the river distances and travel times, together with the time required for each step of the warning. [16]
That system also needs signals its instruments can recognise. At Baige on the Tibetan Plateau, Zhen Zhang and colleagues examined recordings of the 2018 floods that followed the failure of landslide dams. The outburst flood itself produced a signal that was difficult to detect beyond a few kilometres, although processes during the dam breach were detectable farther away. The researchers linked the weak flood signal to conditions in the channel. Their findings show why a network that detects one mountain flood well may need different station locations or detection methods in another river. [17]
Detection only helps if the information reaches people who can act. In a 2026 scientific Perspective, Rayees Ahmed and colleagues recommend clear responsibility for interpreting data and issuing alerts, alongside community preparation. Residents need to know and practise routes to safety, while authorities need reliable communication and backups for failed power or mobile networks. These arrangements help people use the short time before a dangerous flow arrives. [18]
Ahmed and colleagues also call for countries sharing rivers to exchange information and coordinate responses, and for infrastructure planning to use hazard assessments. [18] Reconstructing the August 26 flood can identify which river reaches carried destructive flows and where earlier detection might provide useful time. For downstream communities, the value of that work depends on receiving a warning while leaving the river corridor is still possible.
Sources
- 2026 Nepal Debris Avalanche and Flash Flood
- 2026 Rasuwa Flash Floods
- An Expert Explains What Happened in Nepal
- Nepal Glacier Collapse and Flood – Before and After
- Nepal Glacial Collapse and Debris Flow
- August 2026 Nepal Trishuli Flood
- A Two-Phase Mechanical Model for Rock-Ice Avalanches
- Dynamic Thermomechanical Modeling of Rock-Ice Avalanches: Understanding Flow Transitions, Water Dynamics, and Uncertainties
- Entrainment of Bed Material by Earth-Surface Mass Flows: Review and Reformulation of Depth-Integrated Theory
- Positive Feedback and Momentum Growth During Debris-Flow Entrainment of Wet Bed Sediment
- The Hazard of Large Debris Flows
- A Massive Rock and Ice Avalanche Caused the 2021 Disaster at Chamoli, Indian Himalaya
- Glacial Lake Outburst Floods as Drivers of Fluvial Erosion in the Himalaya
- Sentinel-2 Captures Before and After Nepal Flash Flood
- Pre-Collapse Motion of the February 2021 Chamoli Rock–Ice Avalanche, Indian Himalaya
- Detection and Potential Early Warning of Catastrophic Flow Events with Regional Seismic Networks
- Seismic Monitoring and Geomorphic Impacts of the Catastrophic 2018 Baige Landslide Hazard Cascades in the Tibetan Plateau
- Ice-Rock Avalanches in a Warming Himalaya Indicate Pathways Toward Effective Preparedness